The Numbers Behind the Table
How IPL 2026 Phase-wise Stats Explain Every Team's Standing

Points tables tell you what happened. Phase-wise stats tell you why. After 36 matches of IPL 2026, the standings have a clear and largely settled shape. But the more interesting story is in the ball-by-ball data—the batting strike rates, dot ball percentages, wicket-taking rates, and boundary counts across each of the four phases: Powerplay, overs 7-11, overs 12-16, and the death. What you find when you look at those numbers is that the points table is almost a perfect reflection of phase-wise execution. Very little of what you see in the standings is luck.
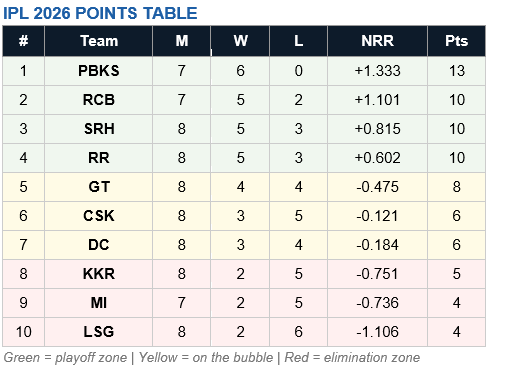
Below is the actual standings table at the time of writing, followed by an honest team-by-team breakdown of what the phase data says and whether their position is deserved, flattering, or unfair.
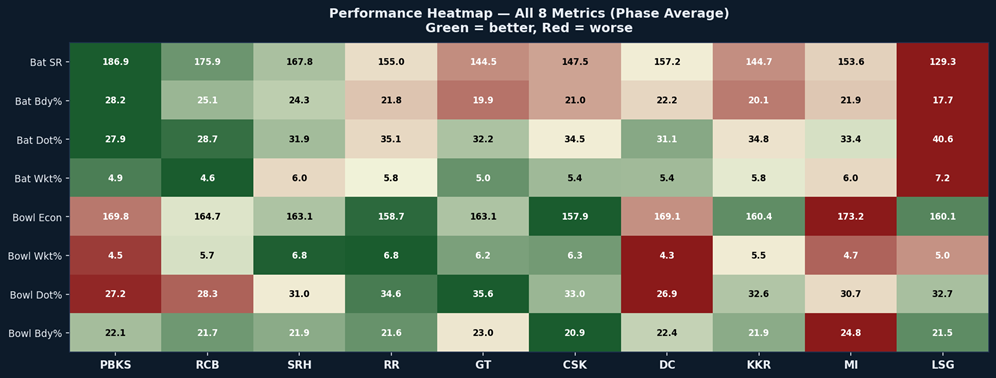
Performance Heatmap Overview
The heatmap below shows each team’s average performance across all 8 metrics, normalized so green always means better regardless of the metric direction. Reading top to bottom almost perfectly mirrors the points table.
The Elite Four: Playoff Contenders (Positions 1–4)
Rank: #1 | Team: PBKS | Points: 13 | NRR: +1.333
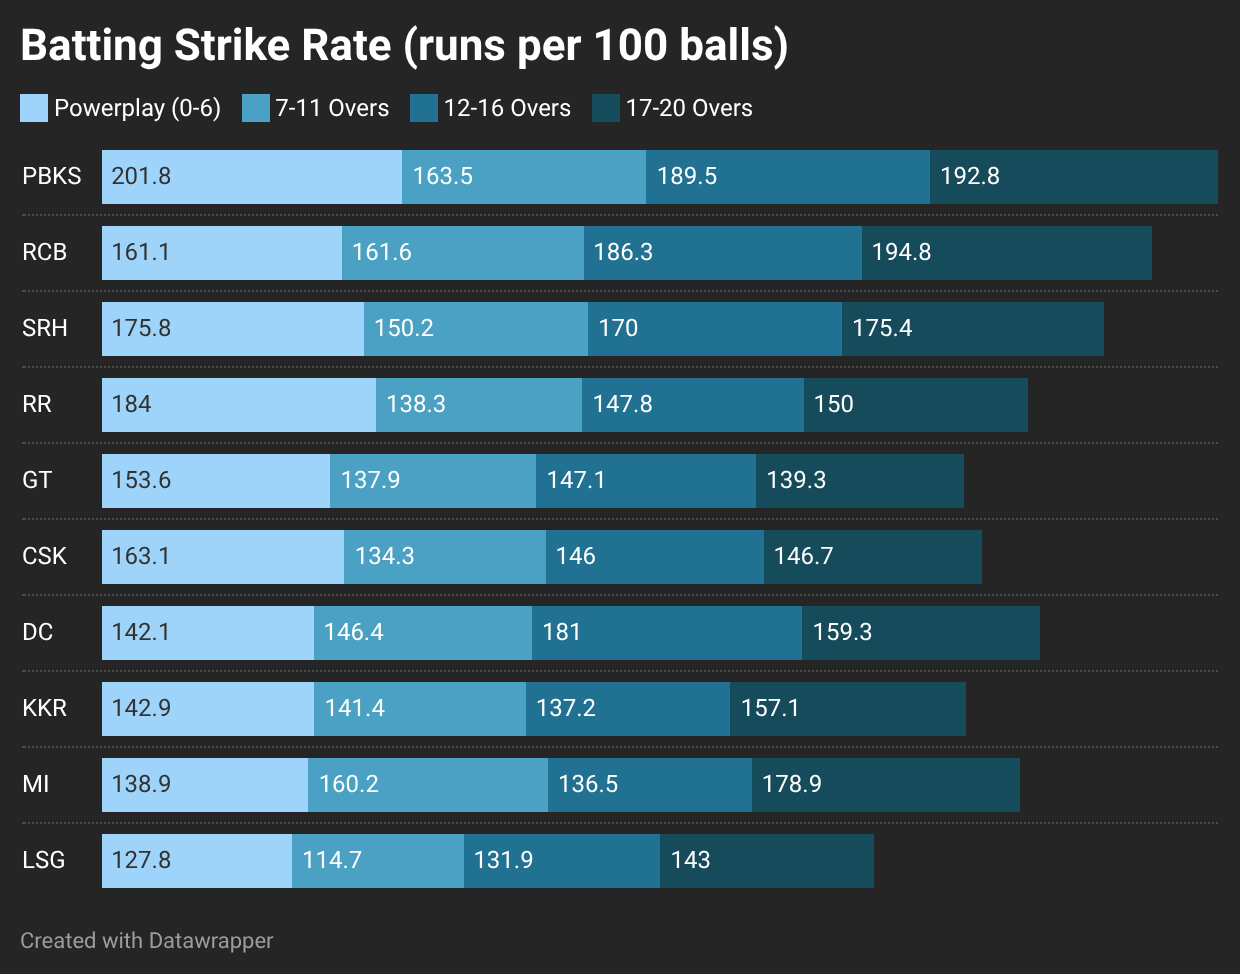
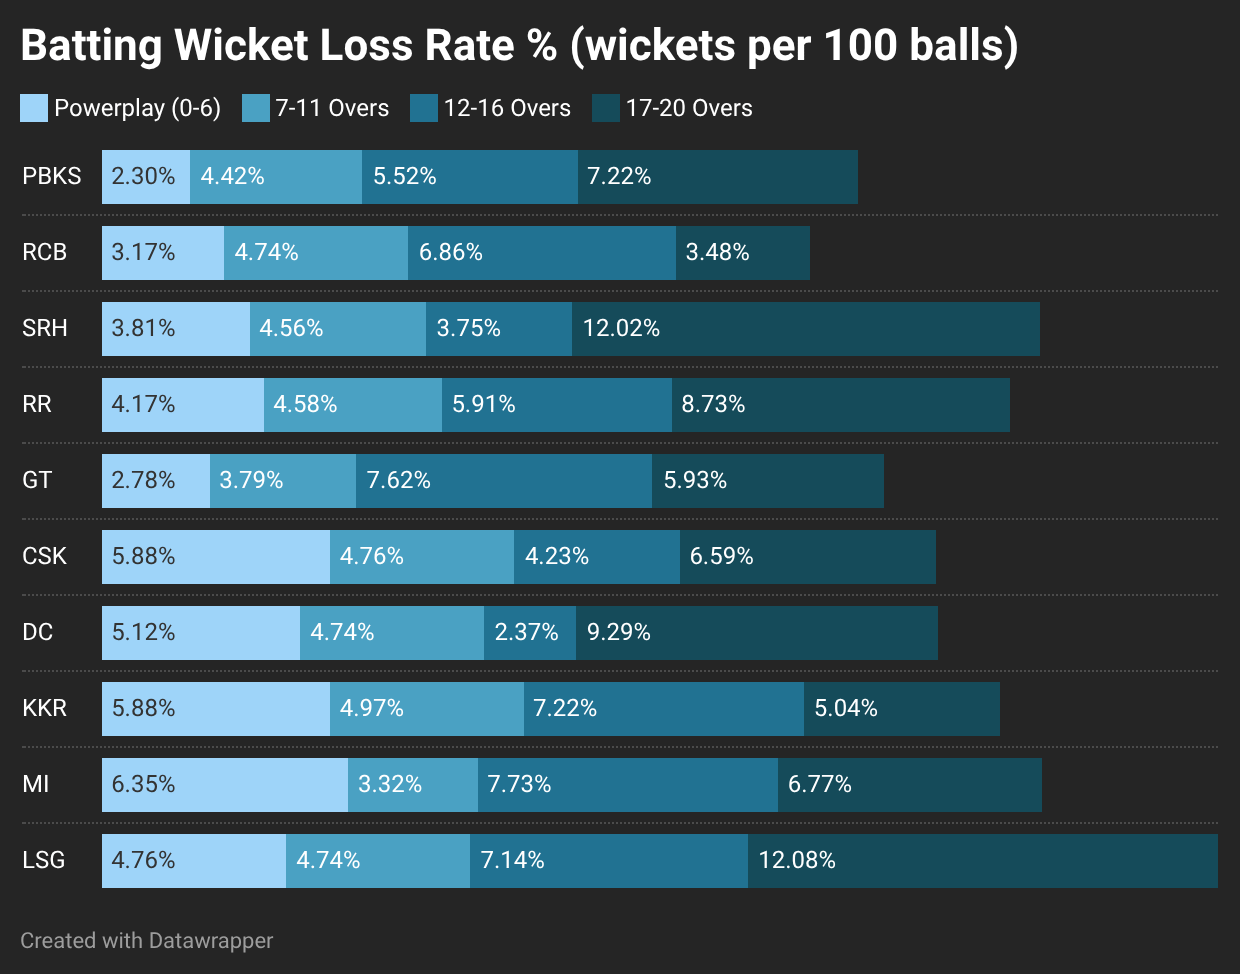
Punjab Kings sit at the top, and the phase data makes it obvious why. Their powerplay batting strike rate of 201.8 is the best in the league—nearly 20 runs per 100 balls ahead of the second-placed team. That is not a marginal edge; that is a structural advantage that plays out in every single match. But here is the detail that separates PBKS from teams that merely hit hard: they are losing wickets at just 2.30% per ball in the powerplay, the lowest in the league. Aggressive and disciplined at the same time.
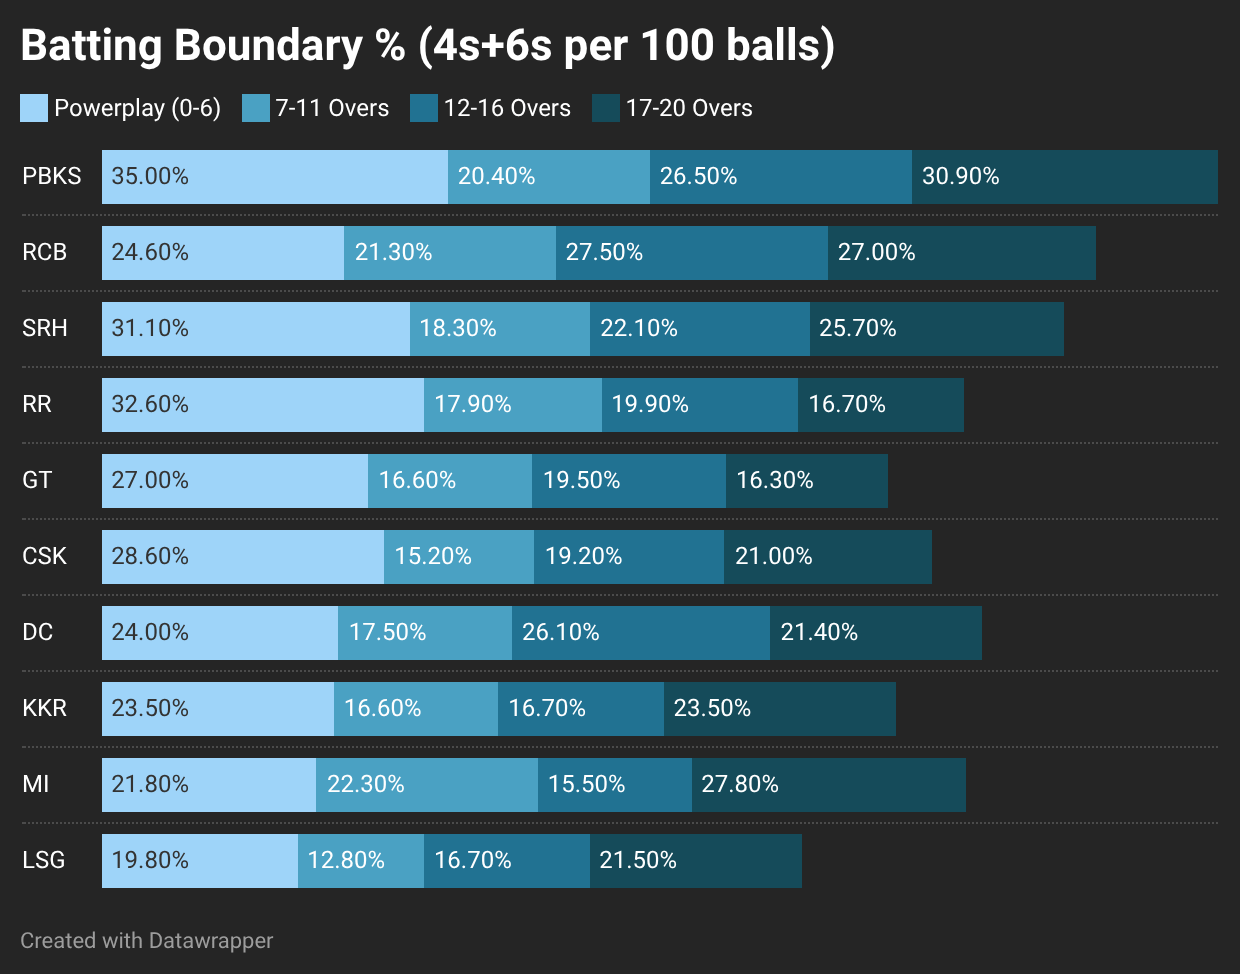
The death phase tells the same story. A batting strike rate of 192.8 with a boundary rate of 30.9% in overs 17-20 means they are not just starting fast—they are finishing hard too. Their bowling does not need to be exceptional because a team that consistently posts 190-plus does not need to defend 160. The NRR of +1.333 is the highest in the competition by a significant distance, and it reflects not just wins but the size of those wins.
▸ Powerplay Bat SR: 201.8 - League Best
▸ PP Wicket Loss Rate: 2.30% - League Best (lowest)
▸ Death Bat SR: 192.8
▸ Death Boundary%: 30.9%
Rank: #2 | Team: RCB | Points: 10 | NRR: +1.101
Royal Challengers Bengaluru is in second place, and their data has one phase that is completely separate from the rest: the death overs with the bat. The best batting strike rate in the league is 194.8 in overs 17–20. They have the lowest dot ball percentage at death, which is 27.0%. They have the lowest rate of losing wickets in the death, at 3.48%. Three different death-batting stats, all of which are the best in the league at the same time. RCB wins close games because they can speed up from almost any spot in the last four overs.
The NRR of +1.101 is the best among the three teams sitting on 10 points, which is why they are second rather than third or fourth despite identical win counts. Their bowling is competitive rather than exceptional across phases, but when your batting can do what theirs does at the end of an innings, the bowling does not need to be the story.
▸ Death Bat SR: 194.8 — League Best
▸ Death Dot Ball%: 27.0% — League Best (lowest)
▸ Death Wicket Loss Rate: 3.48% — League Best (lowest)
▸ Death Bowl Wicket%: 7.84% — Top 3 in league
Rank: #3 | Team: SRH | Points: 10 | NRR: +0.815
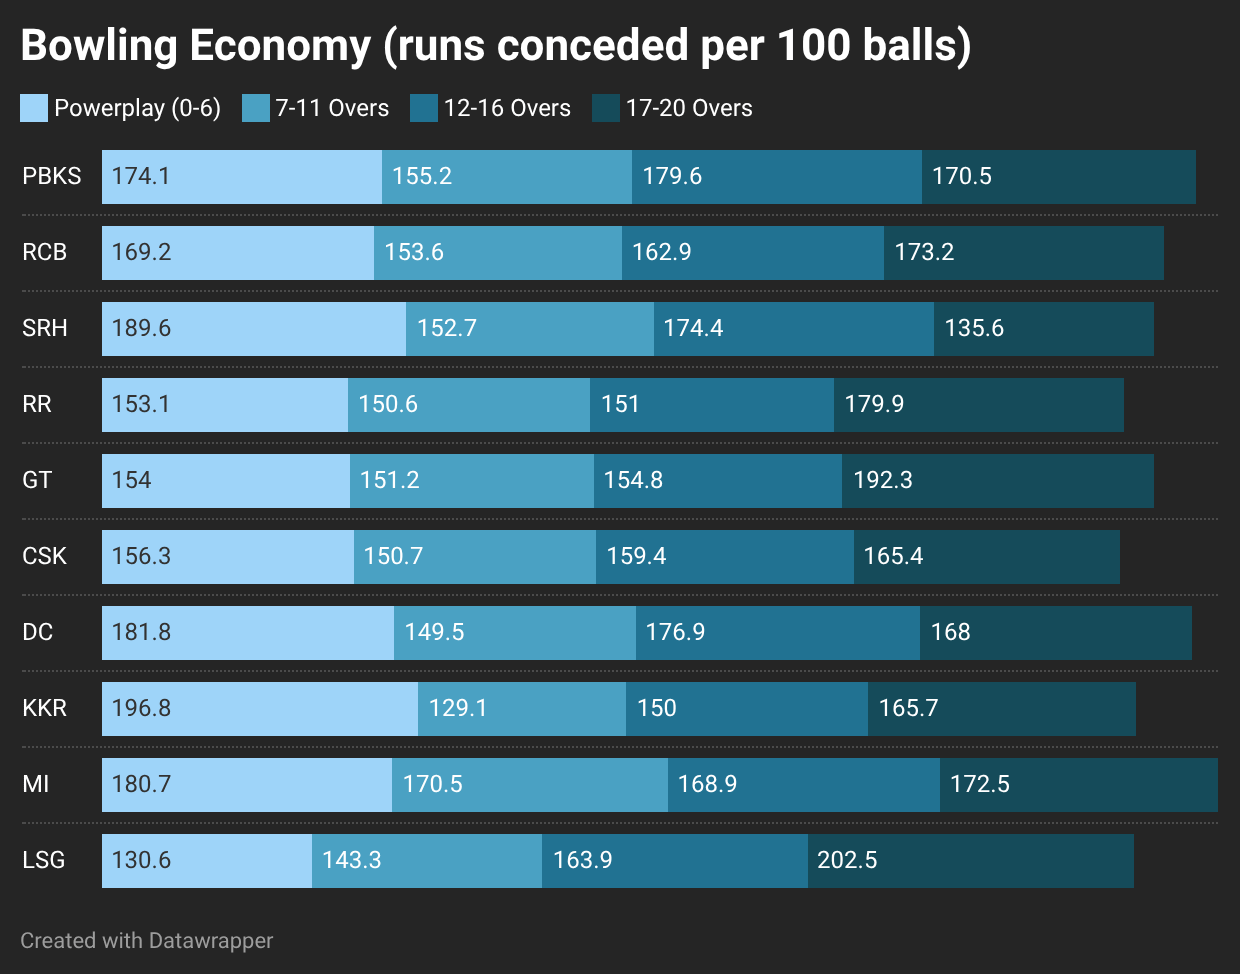
Sunrisers Hyderabad have one number in their bowling stats that is so much better than the rest of the league that it should be read twice. They give up 135.6 runs for every 100 balls they throw. The team that comes in second gives up 165. 4. In T20 cricket, that gap of almost 30 runs per 100 balls in the last few overs is huge. They also have the best death bowling wicket percentage in the league at 10.61% and the best boundary conceded rate at 15.2%. This is why SRH always wins close games. They don't just stop runs at the end; they also get wickets and stop boundaries.
Their batting is solid across all phases without being exceptional anywhere. A powerplay strike rate of 175.8 and a death rate of 175.4 are both comfortably above average. They do not need to post 200 if they can defend 175, and with that bowling attack in death overs, they almost always can.
▸ Death Bowl Economy: 135.6 — League Best (lowest) by massive margin
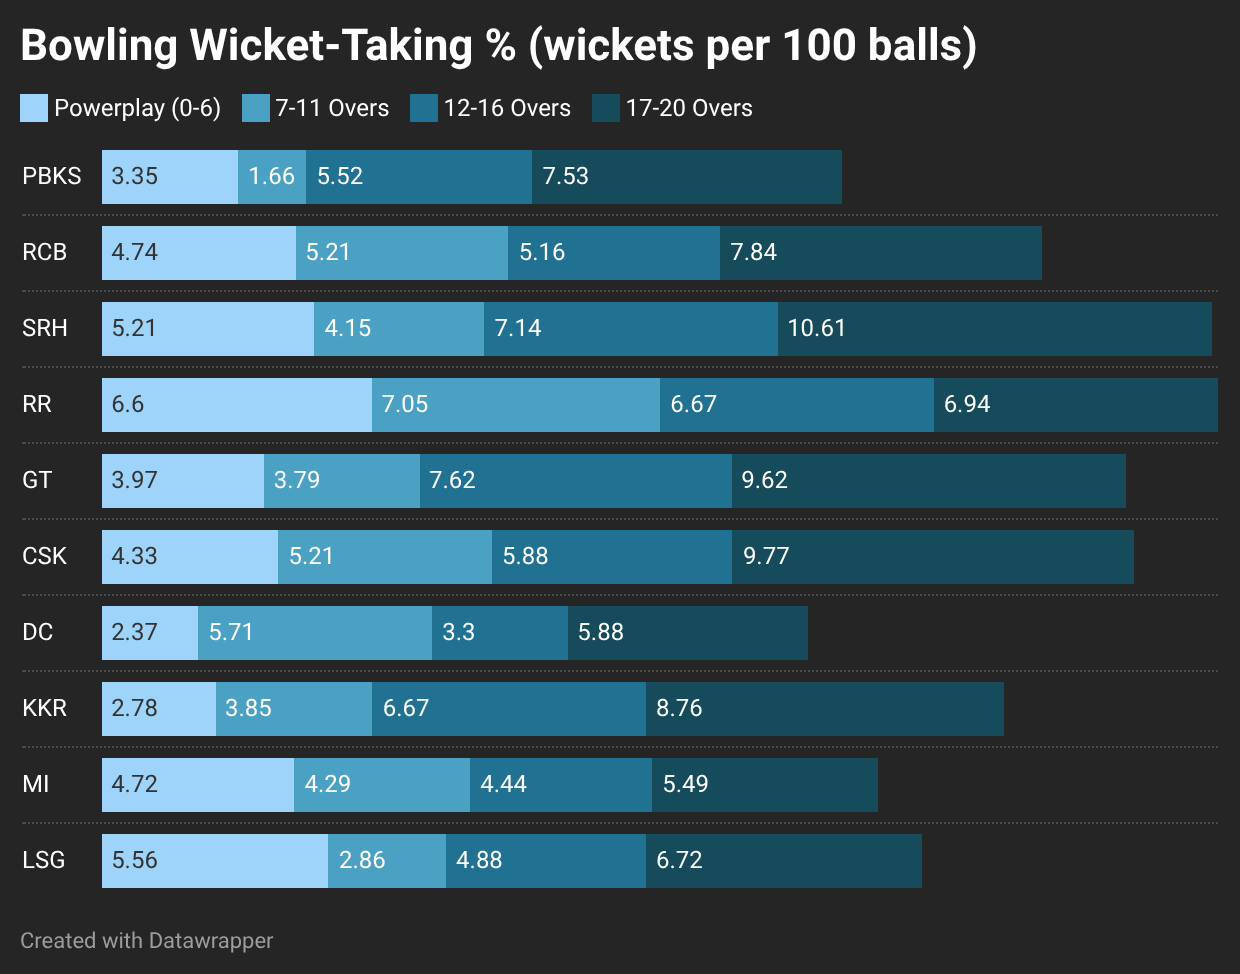
▸ Death Bowl Wicket%: 10.61% — League Best
▸ Death Bowl Boundary Conceded%: 15.2% — League Best (lowest)
Rank #4: RR | 10 Points | NRR: +0.602
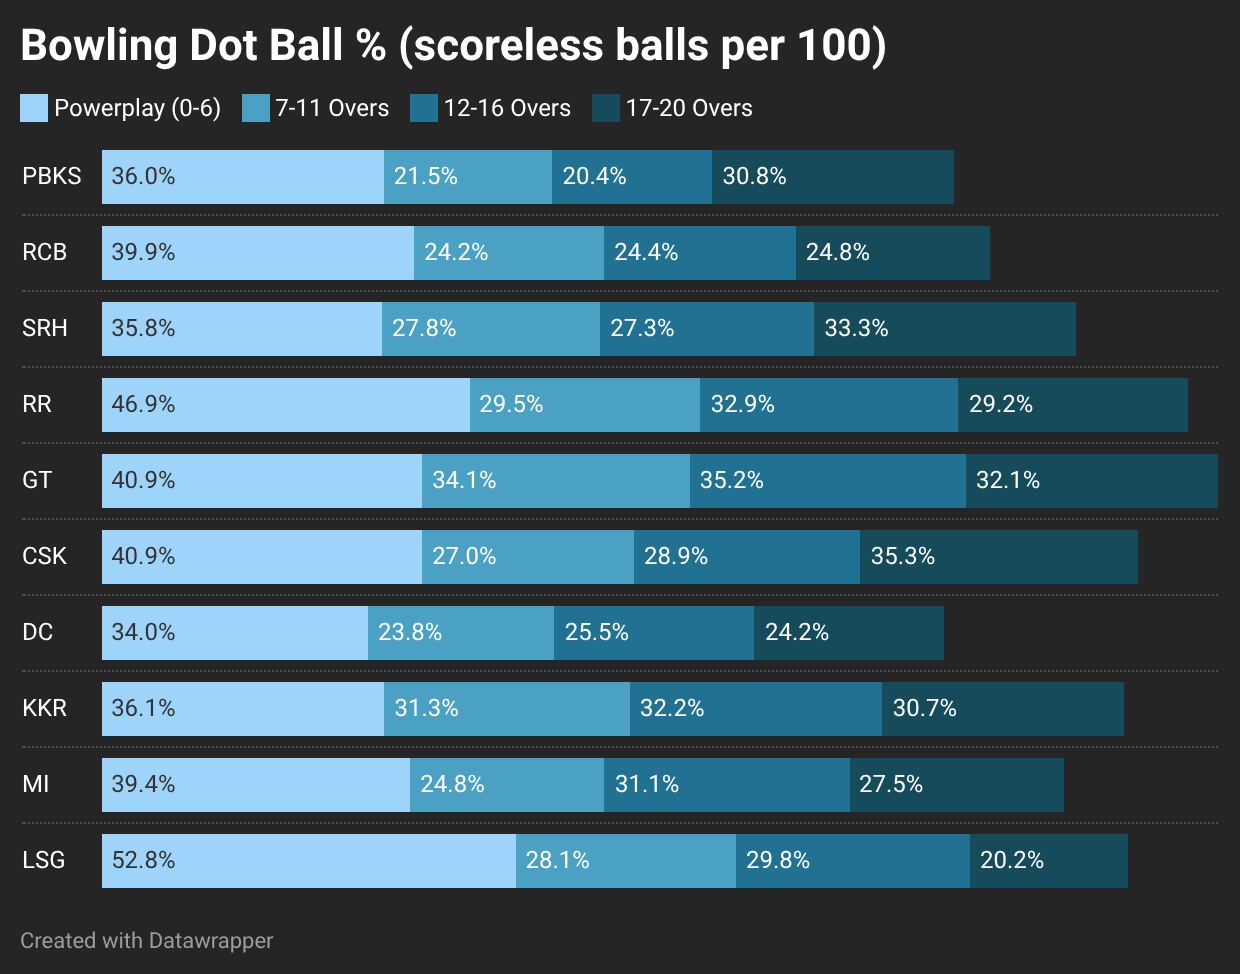
Rajasthan Royals are the bowling team of the tournament in the early phases. Their powerplay bowling wicket percentage of 6.60% is the best in the league. Their 7-11 overs wicket percentage of 7.05% is also the best. Their powerplay bowling dot-ball rate of 46.9% is the best in the league by a notable margin. No other team creates pressure with the ball in the first eleven overs the way RR do, and it shows in how many opposition innings they effectively end before the middle overs have even started.
The batting is the problem in the death. A death batting strike rate of 150.0 puts them in seventh place in the league. The second lowest death boundary rate is 16.7%. RR always wins by defending totals of 170–180, which works, but their NRR of +0.602 is the lowest of the three teams with 10 points, which shows that the margins of victory are small. If they face a high-scoring attack, the batting limits will matter in a knockout.
▸ PP Bowl Wicket%: 6.60% — League Best
▸ 7-11 Bowl Wicket%: 7.05% — League Best
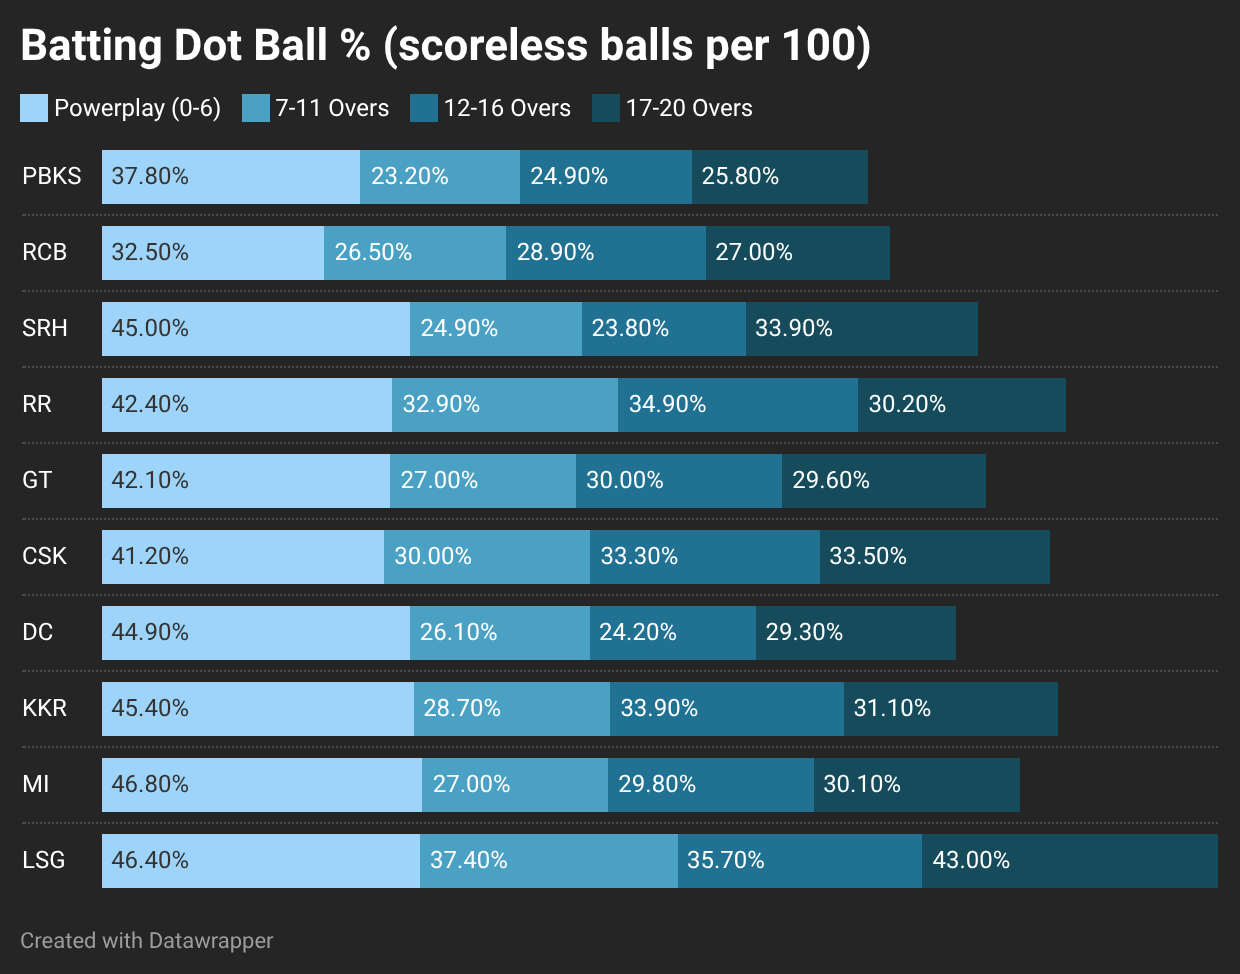
▸ PP Bowl Dot Ball%: 46.9% — League Best
▸ Death Bat SR: 150.0 — 7th in league
THE BUBBLE TEAMS — POSITIONS 5 TO 7
Rank: #5 | Team: GT | Points: 8 | NRR: -0.475
Gujarat Titans in fifth is the most surprising position of the season for a franchise that has never missed the playoffs since its formation. Their bowling data shows a team that controls games well. Dot ball percentages across all four phases range from 32.1% to 40.9%, consistently above the league average. Their death bowling wicket percentage of 9.62% is the second best in the league. They bowl with discipline and take wickets when it matters.
The batting tells the opposite story. A death strike rate of 139.3 is the second lowest in the league. A death boundary percentage of 16.3% is the absolute lowest in the entire competition. GT is a 165-170 run team trying to compete against attacks that expect 185 plus. The bowling keeps them competitive in almost every match, but the batting cannot push totals high enough consistently, and the NRR of -0.475 confirms that when they lose, they lose by more than they win by.
▸ Death Bowl Wicket%: 9.62% — 2nd in league
▸ Death Bat SR: 139.3 — 2nd lowest in league
▸ Death Bat Boundary%: 16.3% — League Worst
Rank: #6 | Team: Chennai Super Kings (CSK) | Points: 6 | NRR: -0.121
Chennai Super Kings are sixth, and the data reveals a team with genuine strengths and one crippling phase problem. In the powerplay with the bat, CSK are strong — a strike rate of 163.1 with a boundary rate of 28.6% is genuinely competitive. Their death bowling wicket percentage of 9.77% is the second best in the league, which means they can take wickets at the right time to defend totals.
The problem is over 7 to 11 with the bat. A strike rate of 134.3 in that phase is the second lowest in the league. The power play ends with CSK looking good, and then the scoring almost stops for four overs. Teams that restrict well in that phase leave CSK 15 to 20 runs short of where they need to be at the halfway point of the innings. They do not have the power play to over 7-11 transition sorted, and it is costing them wins that the bowling nearly rescues.
▸ PP Bat SR: 163.1 — Competitive
▸ 7-11 Bat SR: 134.3 — 2nd worst in league
▸ Death Bowl Wicket%: 9.77% — 2nd in league
Rank: #7 | Team: Delhi Capitals(DC) | Points: 6 | NRR: -0.184
Delhi Capitals are equal on points with CSK but below them on NRR. Their phase data has one extraordinary highlight: a batting strike rate of 181.0 in overs 12-16 is the best in the league, and their wicket loss rate in that same phase at 2.37% is the lowest. DC is exceptional in the transition overs between the middle and the death. Unfortunately, the bowling completely undermines what the batting builds.
A powerplay bowling economy of 181.8 runs per 100 balls is the second worst in the league. Their powerplay bowling wicket percentage of 2.37% is the joint worst. Opposition teams start against DC’s attack in the powerplay and are immediately in control of the game. By the time DC tighten in the middle overs, the chase total is already set in the opposition’s favour. DC wins happen when they bat first and post 185+. When they bowl first, the powerplay concedes so much that they are chasing a shadow for 20 overs.
▸ 12-16 Bat SR: 181.0 — League Best
▸ 12-16 Wicket Loss Rate: 2.37% — League Best (lowest)
▸ PP Bowl Economy: 181.8 — 2nd worst in league
▸ PP Bowl Wicket%: 2.37% — Joint worst in league
THE ELIMINATION ZONE: POSITIONS 8–10
The three teams at the bottom are there because problems are widespread across multiple phases simultaneously. There is no single metric rescue for KKR, MI, or LSG. The data shows teams where both the batting and bowling are underperforming in enough phases that a turnaround within this season looks structurally very difficult.
Rank: #8 | Team: KKR | Points: 5 | NRR: -0.751
Kolkata Knight Riders defending champions are in eighth, the most dramatic fall in recent IPL memory. Their powerplay bowling economy of 196.8 runs per 100 balls is the worst in the league. Their powerplay wicket percentage of 2.78% is joint worst. KKR are giving away the first six overs in almost every match — expensive and wicketless simultaneously, which is the worst possible combination. By the time the fielding restrictions lift, opposition teams are 55-65 without loss and effectively coasting.
The batting does not compensate. A powerplay batting strike rate of 142.9 is among the lower half of the league. The 12-16 overs strike rate of 137.2 is the third lowest. The only phase where KKR bowling is genuinely impressive is overs 7-11, where they restrict to 129.1 runs per 100 balls, the best in the league. But a good 7-11 bowling phase cannot save a game that was already lost in the powerplay.
▸ PP Bowl Economy: 196.8 — League Worst
▸ PP Bowl Wicket%: 2.78% — Joint Worst
▸ 7-11 Bowl Economy: 129.1 — League Best
▸ PP Bat SR: 142.9 — Lower half
Rank: #9 | Team: Mumbai Indians (MI) | Points: 4 | NRR: -0.736
Mumbai Indians in ninth have the most revealing single statistic of any team in the competition: a powerplay batting dot ball percentage of 46.8%. That is the highest in the league. Nearly half of every delivery they face in the powerplay is a scoreless ball. Combined with a powerplay batting strike rate of 138.9, which is the fourth lowest, MI are wasting the phase of the game where the fielding restrictions give the batting side the most advantage. A team that scores this slowly in the powerplay is always behind the game before the middle overs have even started.
The bowling offers no refuge. A powerplay bowling economy of 180.7 is the third worst. A death bowling wicket percentage of 5.49% is below the league average. MI have moments in individual matches where a particular player takes over, but as a unit across phases, they do not execute consistently enough in enough metrics to win regularly. The two wins they have are the result of individual brilliance on specific days, not sustained team excellence.
▸ PP Bat Dot Ball%: 46.8% — League Worst
▸ PP Bat SR: 138.9 — Lower half
▸ PP Bowl Economy: 180.7 — 3rd worst in league
Rank: #10 | Team: Lucknow Super Giants (LSG) | Points: 4 | NRR: -1.106
Lucknow Super Giants are last on NRR at -1.106 and the phase data explains precisely why with merciless clarity. Their powerplay batting strike rate of 127.8 is the worst in the league. Their 7-11 batting strike rate of 114.7 is also the worst in the league. LSG are scoring below run-a-ball for the first eleven overs of their batting innings in almost every match. They are permanently behind the game before the middle even ends. No team can recover from an 11-over deficit of 15-20 runs every single match.
The cruel irony is that LSG have the best powerplay bowling economy in the league at 130.6 runs per 100 balls. They restrict opposition teams extremely well in the powerplay. But a team that scores 127.8 in its own powerplay cannot set totals that make that excellent powerplay bowling count. Their death bowling economy of 202.5 is the worst in the league, meaning they also leak at the death when defending. Both ends of the innings go against them in most matches and the NRR of -1.106 is the honest arithmetic result of that.
▸ PP Bat SR: 127.8 — League Worst
▸ 7-11 Bat SR: 114.7 — League Worst
▸ PP Bowl Economy: 130.6 — League Best
▸ Death Bowl Economy: 202.5 — League Worst
WHAT THE DATA IS REALLY TELLING YOU
Three patterns run through every analysis above and they explain the points table better than anything else.
The first is powerplay batting intent. Every team in the top four scores above 161 in the powerplay. Every team in the bottom three scores below 143. That gap of 18-plus runs per 100 balls over six overs translates to 10-15 runs per innings. Teams that give away the powerplay with the bat are starting every match already in a deficit they cannot fully erase.
The second is death bowling wickets. SRH take wickets at 10.61% in the death. RR take them at 6.94%. GT at 9.62%. CSK at 9.77%. The top half of the table is dominated by teams that take wickets at the end of opposition innings. MI take them at 5.49%. KKR at 8.76% which is good, but their powerplay problems dwarf it. Wickets at the death change the psychology of the final four overs. They are the difference between defending 175 and not.
The third is the overs 7-11 phase, which receives almost no attention in match commentary. CSK drop from a strong powerplay to 134.3 in this phase. LSG go from their already poor 127.8 to 114.7. RCB hold at 161.6 through the phase. PBKS hold at 163.5. The teams that can maintain something close to their powerplay scoring rate through the fielding-back phase are the same teams in the top four. The ones that stall in this phase are the ones who need extraordinary individual performances to rescue their innings.
The points table at match 36 of IPL 2026 is not a snapshot of recent form or momentum. It is a photograph of eight-metric phase execution across thirty-six matches. There is very little accident in these numbers.
For the bubble teams, the paths are clear even if the execution is hard. GT need 15 more runs per innings at the death with the bat. CSK need to stop losing scoring momentum in overs 7-11. DC need to address the powerplay bowling before it makes the rest of their game irrelevant. Any one of these three changes would push a team into genuine playoff contention. The bottom three face problems that are too widespread across too many phases to fix quickly enough to matter in this season.
Supporting Tables & Visual Evidence
The analysis above is interpretive. The tables and charts below provide the quantitative evidence behind those conclusions and highlight the relationship between phase execution and league position.
BATTING STATISTICS — ALL PHASES
Batting Strike Rate (Runs per 100 balls): A higher value indicates superior scoring efficiency.
Boundary Rate (4s + 6s per 100 balls): A higher value reflects superior scoring efficiency and a greater ability to find the boundary consistently.
Dot Ball %: The percentage of deliveries resulting in no runs (lower values indicate better performance).
Wicket Loss Rate (Wickets per 100 balls): Lower values signify better performance.
BOWLING STATISTICS — ALL PHASES
Bowling Economy: Runs conceded per 100 balls (lower is better).
Wicket-Taking Rate (Wickets per 100 balls): This metric measures how frequently a bowler takes a wicket. A higher value indicates a more effective performance.
Bowling Dot Ball %: The percentage of scoreless deliveries per 100 balls. A higher percentage indicates superior bowling performance and pressure.
Boundary Conceded Rate: The number of boundaries (4s & 6s) allowed per 100 balls. (Lower is better)
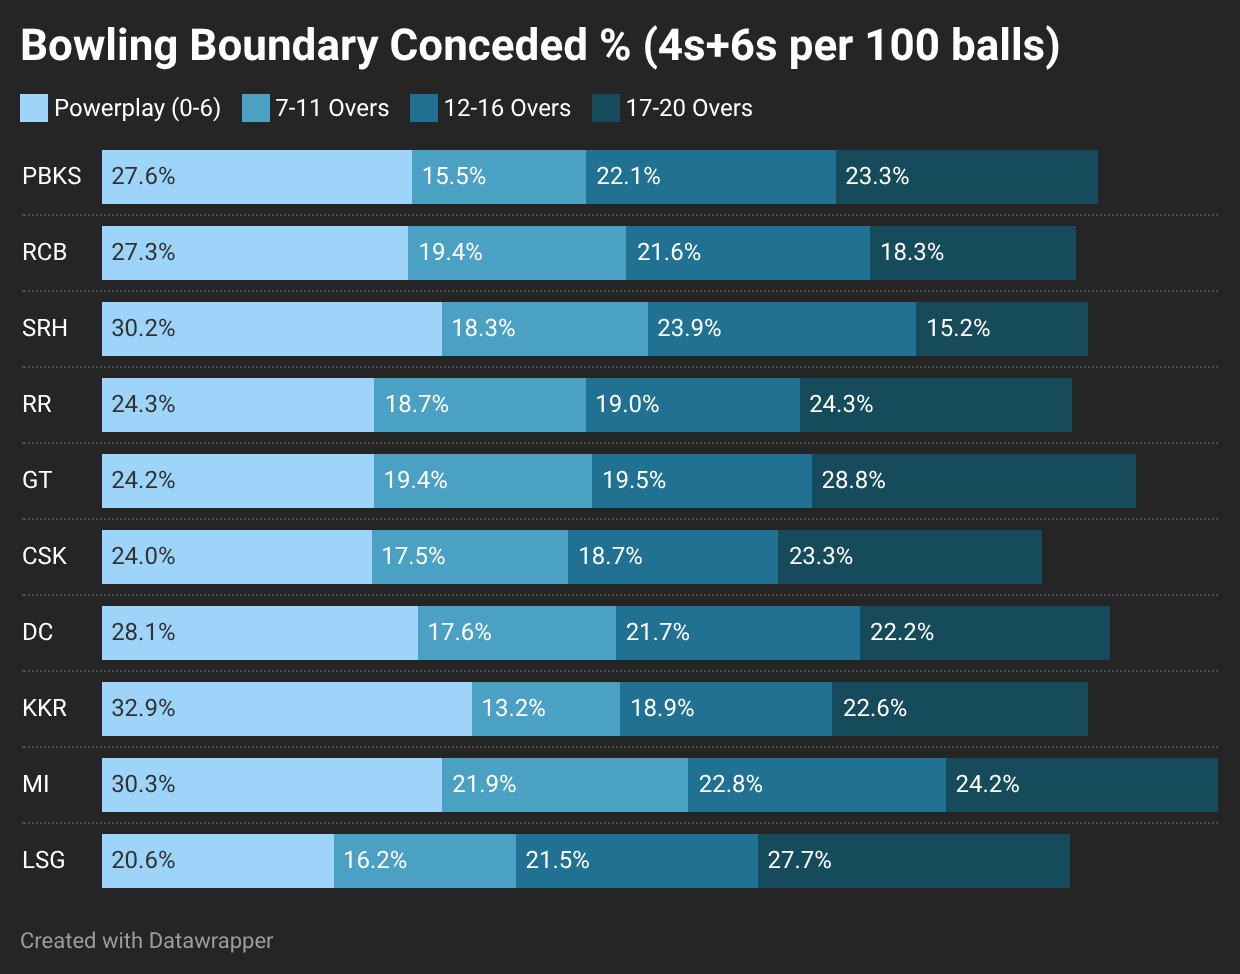
The data and visuals point to one conclusion: teams are sitting where their phase execution says they should be.
https://substack.com/@siddharthanimmaturi/note/c-233477713?r=k58do&utm_medium=ios&utm_source=notes-share-action